Economy
in € million |
2015 |
2014 |
Change |
|||
Employees |
409.0 |
414.0 |
- 1.2 % |
|||
Shareholders |
95.8 |
90.6 |
5.8 % |
|||
Public authorities |
32.0 |
39.5 |
- 19.1 % |
|||
Lenders |
8.7 |
8.0 |
8.1 % |
|||
Total |
545.5 |
552.1 |
- 1.2 % |
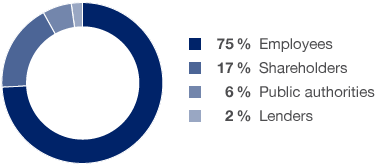
Net added value fell by 1.2 % to € 545.5 million in 2015. At 46.3 %, the added value ratio was slightly up on the previous year. Net added value serves as an indicator of the economic value creation of a business activity. It is calculated by taking the value of production and deducting all intermediate inputs, depreciation and amortisation. Added value is shared between employees, shareholders, the state (taxes) and lenders. The largest proportion, 75.0 % or € 409.0 million, went to employees.
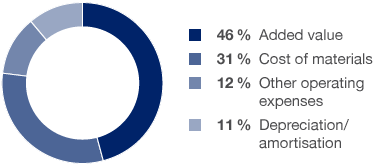
Source of Added Value
Production value 2015: € 1,178 million = 100 %

Application of Added Value
Added value 2015: € 546 million = 100 %

Value added is calculated on the basis of the value of production less input (costs of materials, depreciation, other operating expenses). Value added is distributed to different interest groups in HHLA, such as employees, shareholders, partners, lenders or the state. IAS