Financial Performance Indicators
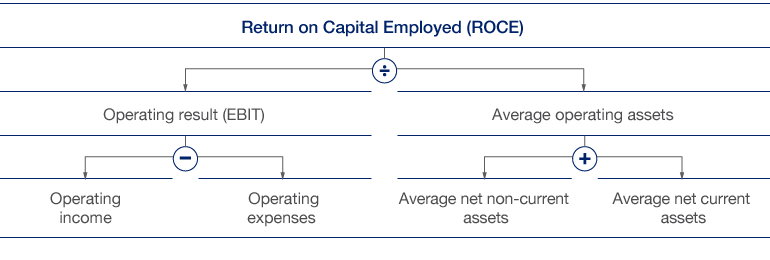
The central financial management control figure is the key performance indicator ROCE, i.e. the return on capital employed. The HHLA Group calculates ROCE as a ratio of the operating result (EBIT) and the average operating assets used.
Value Management
ROCE – defining parameters and influential factors

Commercial activities are generally regarded as value-generating if the return on capital employed exceeds the cost of capital and they make a positive value contribution. Such capital costs correspond to the weighted average of equity costs and the cost of borrowed capital. Due to the ECB’s ongoing expansionary monetary policy, the cost of capital before tax was adjusted from 10.5 % to 8.5 % in the 2015 financial year. This minimum interest rate also reflects the Executive Board’s assessment of a medium- to long-term rate of return arising from a balanced relationship between equity and borrowed capital. This approach avoids short-term fluctuations in interest rates on the capital markets which may distort the information provided by the value management system.
The HHLA Group’s operating result (EBIT) fell year-on-year by 7.5 % to € 156.5 million in the 2015 financial year (previous year: € 169.3 million). see also Group Performance
With average operating assets almost unchanged at € 1,303.1 million (previous year: € 1,307.5 million) the return on capital employed was down 0.9 percentage points on the prior-year figure of 12.0 %. The minimum ROCE of 8.5 % for the 2015 financial year was exceeded by 3.5 percentage points. The HHLA Group therefore generated a positive value added of € 45.7 million in the 2015 financial year (previous year: € 32.0 million).
in € million |
2015 |
2014 |
Change |
|||||
|
||||||||
Operating income |
1,191.0 |
1,241.0 |
- 4.0 % |
|||||
Operating expenses |
- 1,034.5 |
- 1,071.7 |
- 3.5 % |
|||||
EBIT |
156.5 |
169.3 |
- 7.5 % |
|||||
Ø Net non-current assets |
1,213.3 |
1,221.6 |
- 0.7 % |
|||||
Ø Net current assets |
89.8 |
85.9 |
4.5 % |
|||||
Ø Operating assets |
1,303.1 |
1,307.5 |
- 0.3 % |
|||||
ROCE in % |
12.0 |
12.9 |
- 0.9 pp |
|||||
Capital costs before tax1 in % |
8.5 |
10.5 |
- 2.0 pp |
|||||
Capital costs before tax |
110.8 |
137.3 |
- 19.3 % |
|||||
Value added in % |
3.5 |
2.4 |
1.1 pp |
|||||
Value added |
45.7 |
32.0 |
42.9 % |
|||||
EBIT / average operating assets
Earnings before interest and taxes.
Average net non-current assets (intangible assets, property, plant and equipment, investment properties) + average net current assets (inventories + trade receivables – trade liabilities).
Expenses that must be incurred to utilise financial resources as equity or borrowed capital.