Economy
in € million |
2016 |
2015 |
Change |
|||
Employees |
451.9 |
409.0 |
10.5 % |
|||
Shareholders |
105.1 |
95.8 |
9.6 % |
|||
Public authorities |
41.0 |
32.0 |
28.0 % |
|||
Lenders |
7.3 |
8.7 |
- 16.0 % |
|||
Total |
605.3 |
545.5 |
10.9 % |
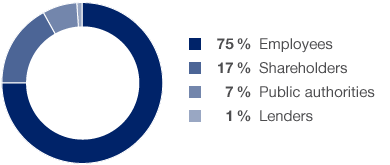
Net added value rose by 10.9 % to € 605.3 million in the 2016 financial year. At 48.8 %, the added value ratio was slightly up on the previous year. Net added value serves as an indicator of the economic value creation of a business activity. It is calculated by taking the production value and deducting all intermediate inputs, depreciation and amortisation. Added value is shared between employees, shareholders, the state (taxes) and lenders. The largest proportion, 74.7 % or € 451.9 million, went to employees.
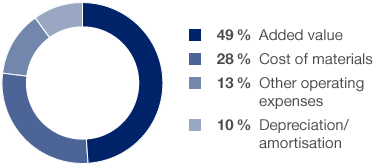
Source of Added Value
Production value 2016: € 1,240 million = 100 %

Application of Added Value
Net added value 2016: € 605 million = 100 %

Production value – intermediate inputs (cost of materials, depreciation and amortisation, and other operating expenses); the value added generated is shared between the HHLA Group’s stakeholders, such as employees, shareholders, lenders and the local community.
Production value – intermediate inputs (cost of materials, depreciation and amortisation, and other operating expenses); the value added generated is shared between the HHLA Group’s stakeholders, such as employees, shareholders, lenders and the local community.