Earnings Position
HHLA’s performance data developed positively in 2016. Container throughput rose slightly year-on-year by 1.5 % to 6,658 thousand TEU (previous year: 6,561 thousand TEU). This was largely due to a stabilisation of volumes on Far East routes and the recovery of feeder volumes to and from Russia. Transport volumes increased significantly by 6.8 % to 1,408 thousand TEU (previous year: 1,318 thousand TEU). This trend was driven by growth in rail transportation.
Revenue
in € million
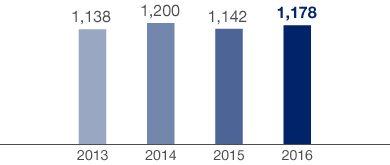

Against this background, revenue of the HHLA Group rose by 3.1 % to € 1,177.7 million (previous year: € 1,141.8 million) in the reporting period. This was primarily due to volume-related growth in container throughput and container transport. The listed Port Logistics subgroup largely developed in line with the HHLA Group as a whole. Its Container, Intermodal and Logistics segments recorded an overall increase in revenue of 3.1 % to € 1,146.0 million (previous year: € 1,111.0 million). The non-listed Real Estate subgroup also succeeded in raising revenue by 3.2 % to € 37.7 million (previous year: € 36.5 million). The Real Estate subgroup thus accounted for 2.7 % of Group revenue.
Whereas changes in inventories in the previous year included expenses of € 1.4 million resulting primarily from consultancy activities, there was no significant effect in the reporting period. Own work capitalised decreased to € 6.5 million (previous year: € 9.3 million).
The increase in other operating income to € 57.5 million (previous year: € 41.2 million) is mainly attributable to the one-off effect from the termination of the lease for the Übersee-Zentrum.
Operating Expenses
Expense structure 2016
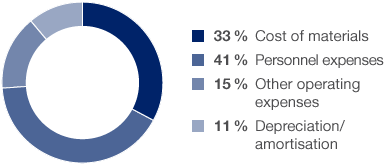

The 4.2 % increase in operating expenses to € 1,077.9 million (previous year: € 1,034.4 million) was slightly above the increase in revenue. There were highly divergent trends across the different expenditure types.
The cost of materials declined by 3.2 % year-on-year to € 350.0 million (previous year: € 361.7 million). In addition to effects from the discontinuation of project and contract logistics activities, there were also effects from improved capacity utilisation and a better mix of import and export volumes in rail transportation. Additional savings were achieved through cheaper energy costs. The cost of materials ratio decreased to 29.7 % (previous year: 31.7 %).
Personnel expenses rose by 10.3 % to € 443.0 million (previous year: € 401.6 million). In addition to higher union wage rates and the inclusion of new companies in the consolidated group, the rise was also due to increased headcount in the Intermodal segment caused by growth and consolidation, greater demand for external staff at the container terminals in Hamburg as a result of volume growth, and one-off expenses relating to restructuring, especially in connection with the discontinuation of project and contract logistics activities. The personnel expense ratio rose by 2.4 percentage points to 37.6 % (previous year: 35.2 %).
Other operating expenses increased by 11.1 % in the reporting period to € 162.5 million (previous year: € 146.3 million). The rise is mainly attributable to provisions in connection with an onerous lease in the Intermodal segment as well as the insolvency of the container shipping company Hanjin. The ratio of expenses to revenue rose accordingly to 13.8 % (previous year: 12.8 %).
Depreciation and amortisation declined slightly by 1.9 % year-on-year and amounted to € 122.4 million (previous year: € 124.9 million).
Against the background of these developments, the operating result before depreciation and amortisation (EBITDA) rose by 1.8 % to € 286.4 million (previous year: € 281.4 million) and thus more slowly than revenue. There was a corresponding slight decrease in the EBITDA margin to 24.3 % (previous year: 24.6 %).
Operating Result (EBIT)
in € million / EBIT margin in %
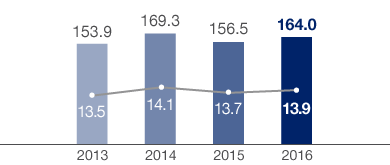

The operating result (EBIT) increased by 4.8 % to € 164.0 million in the reporting period (previous year: € 156.5 million). As this was faster than revenue growth, the EBIT margin rose by 0.2 percentage points to 13.9 % (previous year: 13.7 %). Both the Container segment and the Intermodal segment contributed to the increase in earnings, thus lifting the EBIT result of the Port Logistics subgroup by 4.7 % to € 147.6 million (previous year: € 141.1 million). As a result, the subgroup accounted for 90.0 % (previous year: 90.1 %) of the Group’s operating result in the reporting period. In the Real Estate subgroup, EBIT rose by 5.9 % to € 16.0 million (previous year: € 15.2 million). 10.0 % of the Group’s operating result was generated by this subgroup (previous year: 9.9 %).
Net expenses from the financial result fell by € 10.7 million or 37.3 % to € 18.0 million (previous year: € 28.7 million). This was mainly due to a reduction in negative exchange rate effects to € 2.2 million (previous year: € 8.0 million), which resulted almost entirely from the devaluation of the Ukrainian currency. The revaluation of a settlement obligationn payable to a minority shareholder in conjunction with a profit and loss transfer agreement also led to a reduction in net expenses.
At 28.1 %, the Group’s effective tax rate was higher than in the previous year (25.0 %). The main reasons for this are a one-off tax expense for prior years in the Port Logistics subgroup, as well as the absence of tax effects that had reduced the tax rate in the previous year.
Profit after tax and minority interests increased by 9.5 % year-on-year to € 73.0 million (previous year: € 66.7 million). Non-controlling interests accounted for € 32.0 million in the 2016 financial year (previous year: € 29.2 million). From a financial point of view, this item also includes the effects mentioned in relation to the financial result associated with the settlement obligation to a minority shareholder. Earnings per share rose accordingly by 9.5 % to € 1.00 (previous year: € 0.92). The listed Port Logistics subgroup achieved a 8.1 % increase in earnings per share to € 0.91 (previous year: € 0.84). Earnings per share of the non-listed Real Estate subgroup were up on the prior-year figure at € 3.44 (previous year: € 2.86). As in the previous year, there was no difference between basic and diluted earnings per share in 2016. The return on capital employed (ROCE) was up 0.4 percentage points year-on-year at 12.4 % (previous year: 12.0 %). see also Corporate and Value Management
As in the previous year, HHLA’s appropriation of profits is oriented towards the development of earnings in the HHLA Group in the financial year ended. The distributable profit and HHLA’s stable financial position form the foundation of the company’s consistent profit distribution policy. On this basis, the Executive Board and Supervisory Board will propose at the Annual General Meeting on 21 June 2017 a dividend distribution of € 0.59 per Class A share and € 2.00 per Class S share. Based on the number of shares with dividend entitlement as of 31 December 2016, the sum distributed for listed Class A shares would total € 41.3 million, as in the previous year, while the amount for non-listed Class S shares would rise by 14.3 % to € 5.4 million. In relation to the consolidated profit and the earnings per share, the dividend payout ratio would reach a high figure of approximately 65 % for the Port Logistics subgroup (previous year: 70 %) and around 58 % for the Real Estate subgroup (previous year: 61 %).
A TEU is a 20-foot standard container, used as a unit for measuring container volumes. A 20-foot standard container is 6.06 metres long, 2.44 metres wide and 2.59 metres high.
Vessels which carry smaller numbers of containers to ports. From Hamburg, feeders are primarily used to transport boxes to the Baltic region.
A TEU is a 20-foot standard container, used as a unit for measuring container volumes. A 20-foot standard container is 6.06 metres long, 2.44 metres wide and 2.59 metres high.
Transportation via several modes of transport (water, rail, road) combining the specific advantages of the respective carriers.
Revenue from sales or lettings and from services rendered, less sales deductions and VAT.
Revenue from sales or lettings and from services rendered, less sales deductions and VAT.
In maritime logistics, a terminal is a facility where freight transported by various modes of transport is handled.
Earnings before interest, taxes, depreciation and amortisation.
Earnings before interest and taxes.
Transportation via several modes of transport (water, rail, road) combining the specific advantages of the respective carriers.
Earnings before interest and taxes.
Interest income – interest expenses +/– earnings from companies accounted for using the equity method +/– other financial result.
EBIT / Average Operating Assets.