Financial Position
Balance Sheet Analysis
Compared with the previous year, the HHLA Group’s balance sheet total increased by a total of € 22.4 million to € 1,835.3 million as of 31 December 2017.
in € million |
31.12.2017 |
31.12.2016 |
||
Assets |
|
|
||
Non-current assets |
1,348.0 |
1,329.0 |
||
Current assets |
487.3 |
483.9 |
||
|
1,835.3 |
1,812.9 |
||
|
|
|
||
Equity and liabilities |
|
|
||
Equity |
602.4 |
570.8 |
||
Non-current liabilities |
993.8 |
1,028.1 |
||
Current liabilities |
239.1 |
214.0 |
||
|
1,835.3 |
1,812.9 |
On the assets side of the balance sheet, non-current assets rose by € 19.0 million. This increase stemmed largely from growth in property, plant and equipment due to capital expenditure, which rose by € 23.7 million to € 974.6 million (previous year: € 950.9 million). There was an opposing trend for both intangible assets, which fell by € 6.0 million year-on-year to € 69.7 million (previous year: € 75.7 million) due to scheduled depreciation, and investment property, which decreased by € 4.1 million to € 179.9 million (previous year: € 184.0 million).
Current assets grew by € 3.4 million to € 487.3 million (previous year: € 483.9 million). The increase resulted mainly from a rise in cash and cash equivalents and short-term deposits of € 24.3 million to € 201.5 million (previous year: € 177.2 million). By contrast, trade receivables fell by € 11.3 million to € 149.1 million (previous year: € 160.4 million), while other assets were down by € 13.1 million to € 26.8 million (previous year: € 39.9 million).
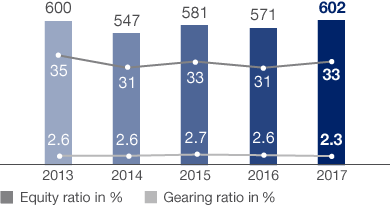
On the liabilities side, equity rose by € 31.6 million compared to year-end 2016, taking it to € 602.4 million (previous year: € 570.8 million). This growth was mainly attributable to positive comprehensive income of € 104.2 million. This was offset by the dividends distributed and the reclassification of a future financial settlement totalling € 72.7 million as a non-current financial liability. The equity ratio increased to 32.8 % (previous year: 31.5 %).
Developments in Group Equity
in € million

Non-current liabilities fell by € 34.3 million to € 993.8 million (previous year: € 1,028.1 million). This reduction was mainly due to a decrease in non-current financial liabilities of € 34.5 million to € 304.7 million (previous year: € 339.2 million), as well as a reduction in pension provisions of € 11.6 million to € 448.9 million (previous year: € 460.5 million). By contrast, other non-current provisions rose by € 10.3 million to € 112.9 million (previous year: € 102.6 million).
Current liabilities grew by € 25.1 million to € 239.1 million (previous year: € 214.0 million). This was primarily attributable to other current provisions, which rose by € 16.9 million to € 34.6 million (previous year: € 17.7 million) and an increase in trade liabilities of € 9.1 million to € 77.2 million (previous year: € 68.1 million).
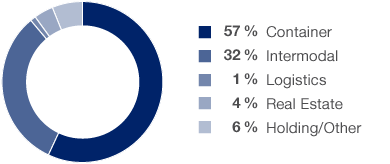
Investments
by segment in 2017

Investment Analysis
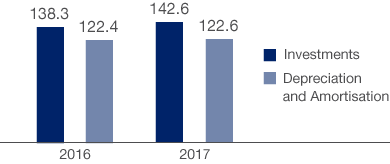
Capital expenditure in the past financial year totalled € 142.6 million (previous year: € 138.3 million). This figure includes additions of € 4.2 million from finance leases not recognised as a direct cash expense (previous year: € 4.1 million). In 2017, capital expenditure focused on extending the Hamburg container terminals and expanding intermodal transport and handling capacities.
Investment projects were largely funded by the operating cash flow generated in the financial year.
Property, plant and equipment accounted for € 131.6 million (previous year: € 123.2 million) of capital expenditure, while intangible assets accounted for € 5.5 million (previous year: € 12.3 million) and investment property for € 5.5 million (previous year: € 2.8 million).
Investments, Depreciation and Amortisation
in € million

Investments amounting to € 81.2 million were made in the Container segment (previous year: € 81.3 million). Capital expenditure was dominated by the procurement of handling equipment and storage capacities at the Hamburg container terminals. The Intermodal segment invested € 45.7 million (previous year: € 44.1 million). The METRANS Group accounted for most of this investment volume, mainly for locomotives. Capital expenditure in the Logistics segment came to € 1.4 million (previous year: € 2.4 million). The pro forma Holding/Other segment invested a total of € 8.4 million (previous year: € 10.3 million). A large proportion of capital expenditure was for the migration to a new terminal management system and for equipment to operate a power barge.
Investments in the Container segment focus on enhancing the productivity of existing terminal areas by using state-of-the-art handling technology and developing berth places for the trend in ship sizes. Meanwhile, in the Intermodal segment, the primary objective is to increase vertical integration to further improve the performance and range of its hinterland connections.
As of year-end, there were other financial liabilities for outstanding purchase commitments totalling € 110.6 million (previous year: € 56.8 million).This figure includes € 77.3 million (previous year: € 34.2 million) for the capitalisation of property, plant and equipment.
Liquidity Analysis
Cash flow from operating activities rose year-on-year from € 234.6 million to € 275.5 million. This increase of € 40.9 million is mainly due to a reduction in trade receivables and other assets of € 58.1 million. Increased EBIT also raised cash flow from operating activities by € 9.2 million. By contrast, a € 24.1 million rise in income tax payments had a negative effect on cash flow from operations.
Cash flow from investing activities (outflow) of € 131.2 million was above the prior-year figure of € 48.9 million. This € 82.3 million rise in cash outflows was mainly due to payments made (previous year: payments received) for short-term deposits (resulting increase in cash outflow: € 55.5 million). At the same time, payments received from the disposal of property, plant and equipment of € 2.0 million were considerably lower in the reporting period (previous year: € 27.0 million).
Free cash flow – the total cash flow from operating and investing activities – decreased to € 144.3 million (previous year: € 185.7 million).
Cash flow from financing activities (outflow) amounted to € 119.0 million in the reporting period (previous year: € 122.4 million) and was therefore € 3.4 million below the prior-year figure.
The HHLA Group had sufficient liquidity as of year-end 2017. There were no liquidity bottlenecks in the course of the financial year. Financial funds totalled € 255.6 million as of 31 December 2017 (31 December 2016: € 232.4 million). Including all short-term deposits, the Group’s available liquidity as of year-end 2017 came to a total of € 275.6 million (previous year: € 251.2 million).
in € million |
2017 |
2016 |
||
Financial funds as of 01.01. |
232.4 |
165.4 |
||
Cash flow from operating activities |
275.5 |
234.6 |
||
Cash flow from investing activities |
- 131.2 |
- 48.9 |
||
Free cash flow |
144.3 |
185.7 |
||
Cash flow from financing activities |
- 119.0 |
- 122.4 |
||
Change in financial funds |
25.3 |
63.2 |
||
Change in financial funds due to exchange rates |
- 2.1 |
- 1.0 |
||
Change in financial funds due to consolidation |
0.0 |
4.8 |
||
Financial funds as of 31.12. |
255.6 |
232.4 |
||
Short-term deposits |
20.0 |
18.8 |
||
Available liquidity |
275.6 |
251.2 |
Financing Analysis
Financial management at the HHLA Group is handled centrally and serves the overriding objective of ensuring the Group’s long-term financial stability and flexibility. Group clearing pools the Group’s financial resources, optimises net interest income and substantially reduces dependency on external sources of funding. Derivative financial instruments can be used to reduce the risk of changes in interest rates and, to a minor extent, to reduce currency and commodity price risks.
HHLA’s business model is dominated by a large proportion of property, plant and equipment with long useful lives. For this reason, HHLA mainly uses medium and long-term loans and finance leases to achieve funding with matching maturities. Pension provisions are also available for long-term internal financing.
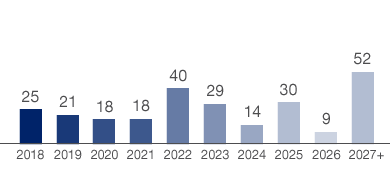
At € 256.9 million as of the balance sheet date, amounts due to banks were below the prior-year figure (€ 298.4 million). The Group did not draw on any additional external financing in the 2017 financial year (previous year: € 10.0 million). Loan repayments of € 41.9 million (previous year: € 42.8 million) were made in the year under review. Due to the maturities agreed and its stable liquidity position, the company had no significant funding requirements.
The majority of the liabilities from loans are denominated in euros, with a small proportion in US dollars. In terms of conditions, approximately 62 % have fixed interest rates and some 38 % have floating interest rates. As a result of borrowing, certain affiliated companies had covenants linked to key balance sheet figures, which mostly require a minimum equity ratio to be met. Covenants are currently in place for approximately 20 % of bank loans. These covenants were met at all agreed audit points throughout the reporting year.
As of the balance sheet date, HHLA disclosed non-current liabilities to related parties totalling € 105.5 million (previous year: € 105.9 million). These resulted from the recognition of the leasing liability to the Hamburg Port Authority (HPA) in connection with quay walls for the mega-ship berths at the HHLA Container Terminal Burchardkai (CTB) and the HHLA Container Terminal Tollerort (CTT).
With the exception of operating leases, there are no significant off-balance sheet financial instruments. These operating leases relate primarily to long-term agreements between the HHLA Group and either the Free and Hanseatic City of Hamburg or HPA for leasing land and quay walls in the Port of Hamburg and the Speicherstadt historical warehouse district.
Cash, cash equivalents and short-term deposits, the bulk of which is held centrally by the holding company, totalled € 201.5 million (previous year: € 177.2 million). These funds are mainly invested at German financial institutions with verified high credit ratings as demand deposits, call money and short-term deposits. Current credit lines play a subordinate role due to HHLA having sufficient liquid funds. As of the balance sheet date, the Group had unused credit facilities amounting to approximately € 3.2 million (previous year: € 0.2 million). The credit line utilisation rate was 67.9 % in the period under review (previous year: 96.8 %). In HHLA’s view, the Group’s solid balance sheet structure would enable more substantial credit facilities to be arranged at any time if its medium-term liquidity planning were to reveal a need. Of the total cash and cash equivalents, € 10.4 million (previous year: € 16.2 million) was subject to restrictions in Ukraine relating to the transfer of currency abroad as of the reporting date. A further € 11.2 million served as collateral for working lifetime accounts.
Maturities of Bank Loans
by year and in € million

As HHLA has a large number of borrowing options at its disposal outside of the capital market, the Group currently sees no need for an external rating. Instead, it provides existing and potential creditors with comprehensive information to ensure that they can derive appropriate internal credit ratings. Furthermore, Deutsche Bundesbank once again confirmed the Group’s eligibility for central bank finance.
Public subsidies awarded for individual development projects that are subject to specific conditions are of minor importance in terms of their volume at Group level.
Acquisitions and Disposals of Companies
In the reporting year, there were no substantial acquisitions or disposals of shares in subsidiaries.
Changes in the Group of Consolidated Companies
In the third quarter of 2017, the companies HHLA Container Terminals Gesellschaft mit beschränkter Haftung, Hamburg, and HHLA Logistics GmbH, Hamburg, were merged into Hamburger Hafen und Logistik Aktiengesellschaft, Hamburg, with effect from 1 January 2017. The companies HPTI Hamburg Port Training Institute GmbH, Hamburg, and Uniconsult Universal Transport Consulting Gesellschaft mit beschränkter Haftung, Hamburg, were also merged into HPC Hamburg Port Consulting GmbH, Hamburg, with effect from 1 January 2017.
The mergers had no effect on HHLA’s Consolidated Financial Statements.
There were no other significant acquisitions, purchases or disposals of shares in subsidiaries, or changes to the group of consolidated companies. see also Note 3 of the Notes to the Consolidated Financial Statements
Payments for investments in property, plant and equipment, investment property and intangible assets.
Equity / balance sheet total.
In maritime logistics, a terminal is a facility where freight transported by various modes of transport is handled.
Transportation via several modes of transport (water, rail, road) combining the specific advantages of the respective carriers.
According to literature on IFRS key figures: EBIT – taxes + depreciation and amortisation – write-backs +/– changes in non-current provisions (excl. interest portion) +/– gain/loss on the disposal of property, plant and equipment + changes in working capital.
Payments for investments in property, plant and equipment, investment property and intangible assets.
In maritime logistics, a terminal is a facility where freight transported by various modes of transport is handled.
A port’s catchment area.
Earnings before interest and taxes.
Financial instruments traditionally used to hedge existing investments or obligations.