Container Segment
in € million |
2015 |
2014 |
Change |
|||
Revenue |
675.2 |
743.7 |
- 9.2 % |
|||
EBITDA |
195.8 |
247.1 |
- 20.8 % |
|||
EBITDA margin in % |
29.0 |
33.2 |
- 4.2 pp |
|||
EBIT |
110.6 |
156.1 |
- 29.1 % |
|||
EBIT margin in % |
16.4 |
21.0 |
- 4.6 pp |
|||
Container throughput in thousand TEU |
6,561 |
7,480 |
- 12.3 % |
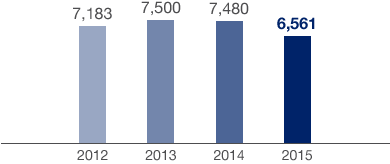
Following the positive trend of the previous years, HHLA’s container terminals recorded their first significant decline in throughput since 2009 in the reporting period. HHLA’s container terminals handled a total of 6,561 thousand TEU on the quayside in 2015, which represents a 12.3 % decline in the number of standard containers (TEU) handled compared to the previous year (7,480 thousand TEU). While container throughput fell 12.6 % to 6,305 thousand TEU at the three container terminals in Hamburg (previous year: 7,217 thousand TEU), throughput at the Container Terminal Odessa was down by just 2.9 % year-on-year at 256 thousand TEU (previous year: 263 thousand TEU).
Development in Container Throughput
in thousand TEU

The changes in volume experienced at the Hamburg terminals were primarily due to dwindling feeder traffic with the Baltic Sea ports, which were down approximately 24 % below the prior-year figure in 2015. In addition to the re-routing of feeder volumes by individual shipping companies, this was primarily due to the trend in traffic with Russia, which fell almost 36 % year-on-year. This drop was, in turn, caused by the consequences of the trade sanctions imposed during the Ukraine crisis which still remain in place, the collapse in oil prices and the strong devaluation of the rouble. As a consequence, the proportion of seaborne handling accounted for by feeders fell to 22.9 % in the 2015 financial year (previous year: 25.6 %). Asian routes (Far East–northern Europe) also declined significantly compared to the previous year. Container transport volumes to and from the Far East decreased by approximately 18 % in 2015. The main cause was the significant weakening of Chinese foreign trade. Exports from China to Europe in particular suffered a steep decline, due to the appreciation of the Chinese renminbi against the euro as well as structural changes in the Chinese economy. Further container terminals were put into operation in Rotterdam (Maasvlakte 2) over the course of 2015, which strongly increased capacity in the North Range as well as the competition between the ports.
The negative market trend in Ukraine led to falling container throughput volumes at the Container Terminal Odessa. The decline was softened to a large extent by market share gains and the terminal’s efficiency.
The strong decline in volumes and year-on-year decrease in storage fees – due to shorter container dwell times – contributed to a fall in revenue of 9.2 % to € 675.2 million (previous year: € 743.7 million). The decreased proportion of low-margin feeder traffic, however, resulted in higher average revenue per container handled at the quayside. Consequently, average revenue rose by 3.5 % compared to the previous year.
The segment’s EBIT costs could not be reduced in proportion to lower seaborne throughput. They declined by just 3.9 %, which is directly related to the high fixed costs associated with container operations. This was mainly due to personnel expenses. These costs were reduced to some extent by using less external staff in the second half of 2015. However, the temporary underutilisation of facilities means it is becoming increasingly difficult to adequately adapt manpower while at the same time being able to handle the peak loads caused by an increasing number of container mega-ships. Increases in union wage rates also had a negative impact. Maintenance costs were also up considerably on the previous year. Due to high capacity utilisation at the facilities last year, some of the necessary maintenance work had to be postponed to 2015. All in all, these factors led to a 29.1 % decrease in the operating result (EBIT) to € 110.6 million (previous year: € 156.1 million). There was a corresponding fall in the EBIT margin to 16.4 % (previous year: 21.0 %).
Despite the overall decline in container throughput in 2015, the company continues to drive the preparation of its facilities for the arrival of ever more container mega-ships. At the Container Terminal Burchardkai (CTB) an order for four additional blocks to increase block storage has been placed, in addition to the order for three more container gantry cranes. As of 2017, these container gantry cranes and storage blocks will lead to further increases in the capacity and quality required for the peak loads of mega-ship handling. An order placed for two container gantry cranes at the Container Terminal Tollerort (CTT) will also enable this terminal to handle the latest generation of ships in future.
Automated block storage is used at the HHLA Container Terminals Altenwerder and Burchardkai to stack containers in a compact and efficient manner. These facilities consist of multiple storage blocks. Rail-Mounted Gantry Cranes are used to transport and stow the boxes.
A crane system used to load and discharge container ships. To handle ever-larger ships, the new container gantry cranes are also significantly bigger in terms of the height and length of their jibs.