Financial Position
Balance Sheet Analysis
Compared with the previous year, the HHLA Group’s balance sheet total decreased as of 31 December 2015 by a total of € 37.7 million to € 1,750.4 million.
in € million |
31.12.2015 |
31.12.2014 |
||
Assets |
|
|
||
Non-current assets |
1,305.8 |
1,308.1 |
||
Current assets |
444.6 |
480.0 |
||
|
1,750.4 |
1,788.1 |
||
|
|
|
||
Equity and liabilities |
|
|
||
Equity |
580.6 |
546.7 |
||
Non-current liabilities |
979.2 |
918.9 |
||
Current liabilities |
190.6 |
322.5 |
||
|
1,750.4 |
1,788.1 |
On the assets side of the balance sheet, non-current assets fell by € 2.3 million. Capital expenditure led to an increase in property, plant and equipment of € 9.0 million to € 947.1 million (previous year: € 938.0 million), while there were declines in the stock of intangible assets ( € - 4.0 million) and investment property ( € - 8.6 million) due to depreciation and amortisation.
Current assets fell by € 35.4 million to € 444.6 million (previous year: € 480.0 million). This decrease was mainly due to a reduction in cash and cash equivalents of € 57.7 million to € 194.6 million. By contrast, receivables from related parties grew by € 22.3 million to € 58.5 million due to inclusion in the HGV cash clearing system.
Developments in Group Equity
in € million
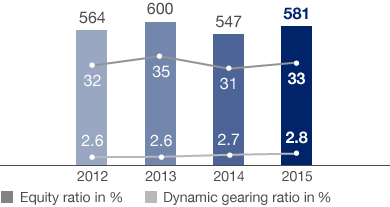

On the liabilities side, equity rose by € 33.9 million to € 580.6 million (previous year: € 546.7 million) compared to year-end 2014. This increase stemmed largely from consolidated net income for the reporting period of € 95.8 million. The change in actuarial gains and losses due to interest rate differentials, netted with deferred taxes, increased equity by € 17.3 million. Foreign currency effects recognised directly in equity had a negative impact of € 11.5 million. Dividends distributed, including the reclassification of a future financial settlement as a non-current financial liability, reduced equity by € 68.1 million. The equity ratio increased to 33.2 % (previous year: 30.6 %).
Non-current liabilities rose by € 60.3 million to € 979.2 million (previous year: € 918.9 million). This increase is due to the placement of promissory loans in the third quarter amounting to € 75.0 million. The funds were borrowed to take advantage of the current low interest rates and to minimise long-term interest rate risks in the Real Estate segment. The reduction in pension provisions of € 28.0 million due mainly to interest rate differentials had an opposing effect.
The decrease in current liabilities of € 131.9 million to € 190.6 million (previous year: € 322.5 million) resulted mainly from the repayment of a current liability due to related parties of € 65.0 million in the third quarter of 2015 following placement of the promissory note loans mentioned above. Due to the repayment of a loan amounting to € 25.0 million and the decrease of € 8.7 million to € 21.6 million for a settlement obligation to a minority shareholder (previous year:€ 30.3 million), current financial liabilities fell by € 31.4 million to € 92.0 million. Trade liabilities were also down € 31.4 million to € 52.0 million.
Investment Analysis
Investments
by segment in 2015
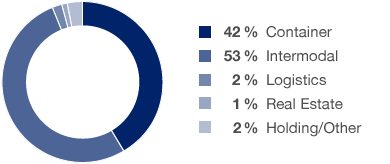

Without inter-company transactions
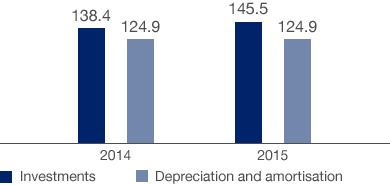
Capital expenditure in the past financial year totalled € 145.5 million (previous year: € 138.4 million). This figure includes additions of € 3.8 million from finance leases not recognised as a direct cash expense (previous year: € 3.9 million). In 2015, capital expenditure focused on extending the Hamburg container terminals and expanding intermodal transport and handling capacities. Investment projects were largely funded by the operating cash flow generated in the financial year.
Property, plant and equipment accounted for € 135.9 million (previous year: € 106.3 million) of capital expenditure, while intangible assets accounted for € 8.8 million (previous year: € 8.3 million) and investment property for € 0.8 million (previous year: € 23.8 million).
Investments amounting to € 61.0 million were made in the Container segment (previous year: € 58.4 million). Capital expenditure in this segment was dominated by the procurement of handling equipment, as well as storage capacities and throughput areas at the Hamburg container terminals. The largest amount of investment was accounted for in the Intermodal segment at € 77.1 million (previous year: € 52.3 million). Investments were primarily made by the Metrans Group, and mainly in locomotives and the construction of an additional terminal. Adjusted for additions to assets from Group transactions, total investments in the Logistics segment amounted to € 2.8 million (previous year: € 2.5 million).
Investments, Depreciation and Amortisation
in € million

Investments in the Container segment focus on enhancing the productivity of existing terminal areas by using state-of-the-art handling technology and developing berth places for the trend in ship sizes. Meanwhile, in the Intermodal segment, the primary objective is to increase vertical integration to further improve the performance and range of its hinterland connections.
As of year-end, there were other financial liabilities for outstanding purchase commitments totalling € 134.4 million (previous year: € 72.7 million). This figure includes € 88.0 million (previous year: € 52.4 million) for the capitalisation of property, plant and equipment.
Liquidity Analysis
Cash flow from operating activities fell year on year from € 233.4 million to € 195.3 million. This decrease of € 38.1 million is primarily due to the year-on-year decline in EBIT of € 12.7 million and a change in trade liabilities and other liabilities of € 21.1 million compared to the 2014 financial year.
Cash flow from investing activities (outflow) of € 130.2 million was above the prior-year figure of € 114.5 million. This increase of € 15.7 million was mainly due to the rise in capital expenditure and investment property. Proceeds from short-term deposits of € 17.0 million (previous year: payments of € 20.0 million) and an increase in payments from the disposal of intangible assets, property,plant and equipment, and investment property totalling € 13.8 million (previous year: € 3.0 million) had an opposing effect.
in € million |
2015 |
2014 |
||
Financial funds as of 01.01. |
185.6 |
151.1 |
||
Cash flow from operating activities |
195.3 |
233.4 |
||
Cash flow from investing activities |
- 130.2 |
- 114.5 |
||
Free cash flow |
65.1 |
118.8 |
||
Cash flow from financing activities |
- 82.7 |
- 79.0 |
||
Change in financial funds |
- 17.6 |
39.8 |
||
Change in financial funds due to exchange rates |
- 2.6 |
- 5.3 |
||
Financial funds as of 31.12. |
165.4 |
185.6 |
Free cash flow – the total cash flow from operating and investing activities – decreased to € 65.1 million (previous year: € 118.8 million).
Cash flow from financing activities (outflow) amounted to € 82.7 million (previous year: € 79.0 million) in the reporting period, and thus increased by € 3.7 million. Due to higher dividend payments, cash outflows increased year-on-year by € 5.6 million. The repayment of loans, including to a related party, and the placement of promissory note loans with an opposing effect resulted in a net cash outflow which was € 1.1 million lower than in the 2014 financial year.
The HHLA Group had sufficient liquidity as of year-end 2015. There were no liquidity bottlenecks in the course of the financial year. Financial funds totalled € 165.4 million as of 31 December 2015 (31 December 2014: € 185.6 million). Including all short-term deposits, the Group’s available liquidity came to a total of € 238.5 million (previous year: € 275.6 million).
Financing Analysis
Financial management at the HHLA Group is managed centrally and serves the overriding objective of ensuring the Group’s long-term financial stability and flexibility. Group clearing pools the Group’s financial resources, optimises net interest income and substantially reduces dependency on external sources of funding. Derivative financial instruments can be used to reduce the risk of changes in interest rates and, to a minor extent, to reduce currency and commodity price risks.
HHLA’s business model is dominated by a large proportion of property, plant and equipment with long useful lives. For this reason, HHLA mainly uses medium and long-term loans and finance leases to achieve funding with matching maturities. Pension provisions are also available for long-term internal financing.
At € 329.6 million, as of the balance sheet date amounts due to banks were higher than in the previous year (€ 284.1 million). The Group drew on additional external financing totalling € 121.3 million (previous year: € 24.7 million) in the 2015 financial year. New borrowing was offset by loan repayments amounting to € 61.5 million. A promissory note loan was used to replace a shareholder loan. This was the main reason for the increase in liabilities from bank loans. Due to the maturities agreed and its stable liquidity position, the company had no other significant funding requirements.
Maturities of Bank Loans
by year and in € million
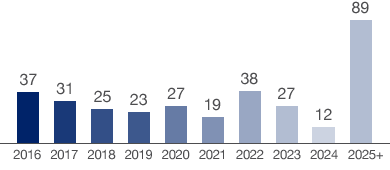

The majority of the liabilities from loans are denominated in euros, with a small proportion in US dollars. In terms of conditions, approximately 73 % have fixed interest rates and some 27 % have floating interest rates. As a result of borrowing, certain Group companies had covenants linked to key balance sheet figures, which mostly require a minimum equity ratio to be met. Covenants are currently in place for around 21 % of bank loans. The covenants were met at all agreed audit points throughout the reporting year. As of the balance sheet date, HHLA posted non-current liabilities to related parties totalling € 106.3 million (previous year: € 106.6 million). These resulted from the recognition of the leasing liability to the Hamburg Port Authority (HPA) in connection with quay walls for the mega-ship berths at the HHLA Container Terminal Burchardkai (CTB) and the HHLA Container Terminal Tollerort (CTT). In the previous year, liabilities to related parties included a shareholder loan of € 65 million in the Real Estate subgroup, which has now been repaid.
With the exception of operating leases, there are no significant off-balance sheet financial instruments. These operating leases relate primarily to long-term agreements between the HHLA Group and either the Free and Hanseatic City of Hamburg or the HPA for leasing land and quay walls in the Port of Hamburg and the Speicherstadt historical warehouse district.
Cash, cash equivalents and short-term deposits, the bulk of which is held centrally by the holding company, totalled € 194.6 million (previous year: € 252.2 million). These funds are mainly invested at German financial institutions with verified high credit ratings as demand deposits, call money and short-term deposits. Current credit lines play a subordinate role due to HHLA having sufficient liquid funds. As of the balance sheet date, the Group had unused credit facilities amounting to some € 1.2 million (previous year: € 3.6 million). The credit line utilisation rate was 83.9 % in the period under review (previous year: 59.5 %). In HHLA’s view, the Group’s solid balance sheet structure would enable more substantial credit facilities to be arranged at any time if its medium-term liquidity planning were to reveal a need. Of the total cash and cash equivalents, € 10.7 million (previous year: € 9.4 million) was subject to restrictions in Ukraine relating to the transfer of currency abroad as of the reporting date.
As HHLA has a large number of borrowing options at its disposal outside of the capital market, the Group currently sees no need for an external rating. Instead, it provides existing and potential creditors with comprehensive information to ensure that they can derive appropriate internal credit ratings.
Public subsidies awarded for individual development projects which are subject to specific conditions are of minor importance in terms of their volume at Group level.
Acquisitions and Disposals of Companies
In the first quarter of 2015, METRANS (Danubia) Kft., Gyor, Hungary, which is not included in HHLA’s group of consolidated companies, acquired 100 % of the shares in both Univer Trans Kft, Budapest, Hungary, and Loacker Konténer Kft., Budapest, Hungary.
The real estate company Loacker Konténer Kft. was renamed METRANS Konténer Kft. in the second quarter of 2015. METRANS (Danubia) Kft. subsequently sold all of the shares in METRANS Konténer Kft. and all of the shares in Univer Trans Kft. to METRANS (Danubia) a.s., Dunajská Streda, Slovakia, which is part of HHLA’s consolidated group.
There were no other substantial acquisitions or disposals of shares in subsidiaries.
Equity / total assets
Payments for investments in property, plant and equipment, investment property and for investments in intangible assets.
Financial instruments that are traditionally used to protect existing investments or obligations. Earnings from associated companies (using the equity method) Earnings of joint ventures or associated companies are included in the financial result in the profit and loss statement.