Earnings Position
There was a different development in HHLA’s performance data in 2015. At 6,561 thousand TEU, container throughput fell strongly year-on-year by 12.3 % (previous year: 7,480 thousand TEU). The cooling of the Chinese economy negatively impacted Far East trades while the recession in Russia led to a steep decline in feeder volumes. By contrast, transport volumes increased slightly by 2.7 % to 1,318 thousand TEU (previous year: 1,283 thousand TEU). This growth is attributable to further market share gains made by the rail subsidiaries.
Revenue
in € million
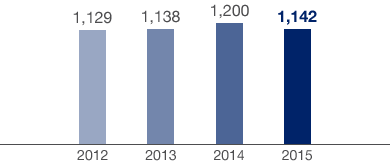

Against this background, revenue of the HHLA Group decreased by 4.8 % to € 1,141.8 million (previous year: € 1,199.6 million) in the reporting period. This was primarily due to a volume-related decline in handling revenue at the Hamburg terminals and temporarily higher storage fees in the previous year. The listed Port Logistics subgroup largely developed in line with the HHLA Group as a whole. Its Container, Intermodal and Logistics segments recorded an overall decline in revenue of 5.1 % to € 1,111.0 million (previous year: € 1,171.2 million). By contrast, the non-listed Real Estate subgroup was able to raise revenue by 9.0 % to € 36.5 million (previous year: € 33.5 million). The Real Estate subgroup thus accounted for 2.7 % of Group revenue.
While changes in inventories had nearly no impact on earnings last year, expenses of € 1.4 million were incurred in the reporting period which were primarily attributable to consultancy activities. The increase in own work capitalised to € 9.3 million (previous year: € 7.9 million) also resulted mainly from this area.
A rise in other operating income to € 41.2 million (previous year: € 33.6 million) was due in part to the sale of rolling stock in the Intermodal segment in the fourth quarter of 2015, as well as to the partial reversal of a provision for legal risks through profit and loss and the disposal of a landplot.
Operating Expenses
Expense structure 2015
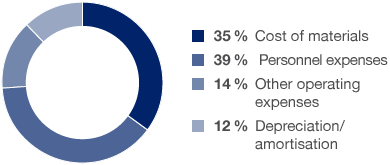

The 3.5 % decrease in operating expenses to € 1,034.4 million (previous year: € 1,071.7 million) was slightly below the decrease in revenue. There were divergent trends across the different expenditure types.
The cost of materials declined by 8.8 % year-on-year to € 361.7 million (previous year: € 396.7 million). The cost of materials ratio decreased to 31.7 % (previous year: 33.1 %). This decrease is mainly related to cost structure changes resulting from the increased use of the company’s own traction, which more than offset the opposing effect of growth in the material-intensive Intermodal segment.
Personnel expenses remained on a par with the previous year at € 401.6 million (previous year: € 401.7 million). The personnel expense ratio climbed by 1.7 percentage points to 35.2 % (previous year: 33.5 %). The increase in headcount in the Intermodal segment following the expansion of its own traction, as well as to higher union wage rates. Moreover, the falling utilisation rate of facilities in the Container segment could not be entirely compensated by a reduction in the use of external staff.
Other operating expenses amounted to € 146.3 million in the reporting period and were thus reduced by 1.5 % year-on-year (previous year: € 148.5 million). This decrease is largely due to a provision for legal risks formed in the previous year. Despite this however, the ratio of expenses to revenue increased to 12.8 % (previous year: 12.4 %). This is partially related to the increase in rental and leasing expenses in the Intermodal segment caused by the expansion of its own traction.
At € 124.9 million, depreciation and amortisation was unchanged from the previous year ( € 124.9 million) as HHLA continued to focus on ship size-related investments at its container terminals, as well as the expansion of the hinterland network and its own traction.
Against the background of these developments, the operating result before depreciation and amortisation (EBITDA) decreased by 4.3 % to € 281.4 million (previous year: € 294.2 million) and thus more slowly than revenue. There was a corresponding slight increase in the EBITDA margin to 24.6 % (previous year: 24.5 %).
Operating Result (EBIT)
in € million / EBIT margin in %
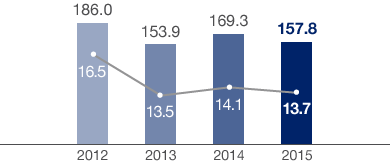

The operating result (EBIT) fell by 7.5 % to € 156.5 million in the reporting period (previous year: € 169.3 million) and the EBIT margin decreased by 0.4 percentage points from 14.1 % in 2014 to 13.7 %. The significant increase in earnings in the Intermodal segment was largely able to compensate for the severe decline in earnings in the Container segment. This decrease in the operating result was once again attributable to the Port Logistics subgroup, where EBIT declined by 9.3 % to € 141.1 million (previous year: € 155.6 million) and thus accounted for 90.1 % (previous year: 91.9 %) of the Group’s operating result in the reporting period. In the Real Estate subgroup, EBIT climbed 13.2 % to € 15.2 million (previous year: € 13.4 million). 9.9 % of the Group’s operating result was generated by this subgroup (previous year: 8.1 %).
Net expenses from the financial result fell by € 10.5 million, or 26.8 %, to € 28.7 million (previous year: € 39.2 million). The interest expense contained in pension provisions declined by € 5.0 million. The revaluation of an equalisation liability payable to a minority shareholder in conjunction with a profit and loss transfer agreement led to a reduction in net expenses from the financial result of € 0.8 million (previous year: € 2.6 million increase). Negative exchange rate effects, due almost exclusively to the devaluation of the Ukrainian currency, reduced the financial result by € 8.0 million, compared to a negative impact on the result of € 10.8 million in the previous year. Earnings from companies accounted for using the equity method, which declined by 29.1 % to € 3.7 million in the reporting period, had an opposing effect (previous year: € 5.3 million).
The Group’s effective tax rate fell to 25.0 % in 2015 (previous year: 30.4 %). This was caused by the absence of a one-off gain that drove up the previous year’s tax rate and by the fact that a higher proportion of profits was generated by foreign subsidiaries.
Profit after tax and minority interests increased by 13.2 % to € 66.7 million (previous year: € 58.9 million). Non-controlling interests accounted for € 29.2 million in the 2015 financial year (previous year: € 31.6 million). From a financial point of view, this item also includes the effects mentioned in relation to the financial result associated with the settlement obligation to a minority shareholder. Earnings per share increased correspondingly by 13.2 % to € 0.92 (previous year: € 0.81). The listed Port Logistics subgroup achieved a 12.8 % increase in earnings per share to € 0.84 (previous year: € 0.75). Earnings per share for the non-listed Real Estate subgroup were up year-on-year at € 2.86 (previous year: € 2.46). As in the previous year, there was no difference between basic and diluted earnings per share in 2015.
As in the previous year, HHLA’s appropriation of profits is oriented towards the development of earnings in the HHLA Group in the financial year ended. The distributable profit and HHLA’s stable financial position form the foundation of the company’s consistent profit distribution policy.
On this basis, the Executive Board and Supervisory Board will propose at the Annual General Meeting on 16 June 2016 a dividend distribution of € 0.59 per Class A share and € 1.75 per Class S share. Based on the number of shares with dividend entitlement as at 31 December 2015, the sum distributed for listed Class A shares would increase on the previous year by 13.5 % to € 41.3 million, while the amount for non-listed Class S shares would rise by 16.7 % to € 4.7 million. In relation to the consolidated profit and the earnings per share, the dividend payout ratio would once again reach a comparably high figure of approximately 70 % for the Port Logistics subgroup and around 61 % for the Real Estate subgroup.
A TEU is a 20-foot standard container, used as a unit for measuring container volumes. A 20-foot standard container is 6.06 metres long, 2.44 metres wide and 2.59 metres high.